
The Indicator provides advance warnings of whether employment is likely to grow faster or slower than its long-term trend rate of growth and is produced by the Australian Government Department of Employment. The Department of Employment’s Monthly Leading Indicator of Employment (the Indicator) has fallen for the sixth consecutive month in September 2017.
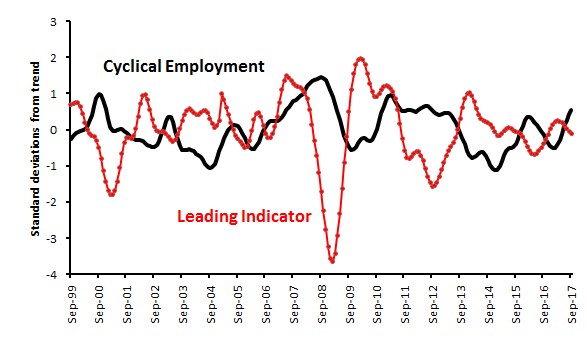
Levels of the Leading Indicator of Employment and Cyclical Employment

Monthly Changes in Value of Leading Indicator*
| Apr-17 | May-17 | Jun-17 | Jul-17 | Aug-17 | Sep-17 | |
|---|---|---|---|---|---|---|
| ∆ Leading Indicator | -0.018 | -0.049 | -0.076 | -0.082 | -0.076 | -0.055 |
*monthly changes in standard deviations from the cyclical trend
Components of the Leading Indicator (Short-term Trend)**
| Series | Change over the Year | Change over the Month | Contribution to Change in Leading Indicator |
|---|---|---|---|
| NBSC Purchasing Managers’ Index for Manufacturing Output in China (September 2017 release) | 2.3% | 0.0% | -0.005 |
| US Yield Difference (10-year vs. 3 month interest rates, September 2017 release) | -0.2 pts | -0.1 pts | -0.019 |
| NAB Forward Orders Index (August 2017 release) | 0.7 pts | 0.2 pts | 0.006 |
| Westpac-Melbourne Institute Leading Index of Economic Activity (August 2017 release) | 0.5% | 0.0% | -0.002 |
| Westpac-Melbourne Institute Consumer Sentiment Index (August 2017 release) | -5.6% | -0.7% | -0.035 |
| ∆ Leading Indicator: | -0.055 | ||
**Note: The cyclical components of each series, and not the trend percentage changes shown above, contribute to the movements in the Indicator. Data have been trended by the Department of Employment using the Henderson 13-term centred-moving-average process. Each series in the Indicator has the same weight of 20 per cent. The units of measurement for the contributions to change in the Indicator in the rightmost column are monthly changes in the standard deviation from the long-term trend. NBSC stands for the National Bureau of Statistics of China.
Read the full September 2017 report.